

TAPFLOW Cloud Portal
A tiny light for bartenders. A surprisingly large dashboard for everyone else.
The TAPFLOW Cloud Portal shows every tap, bar and venue in real time: pours, sales, temperatures, cleaning and alerts. Built for the people who like numbers, and the people responsible for them.
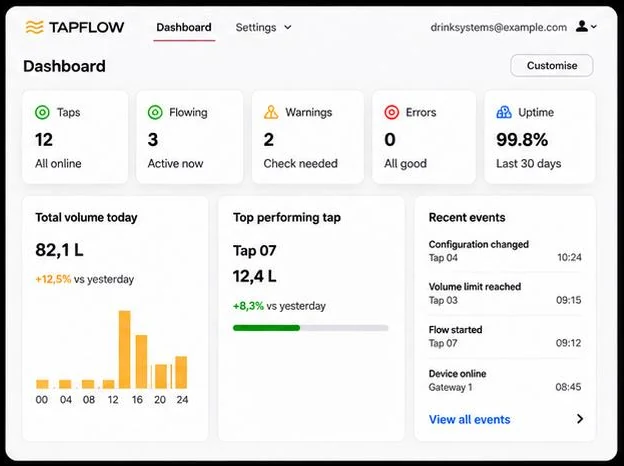
Somewhere between the keg and the customer, a surprising amount of beer disappears.
- 10–20 %of draft beer can be wasted at the point of dispense.
- 5–8 %can be lost through overpours and inconsistent pouring alone.
Our mission: to eliminate waste, one pour at a time. Sources: ProBrewer, FloTEQ USA.
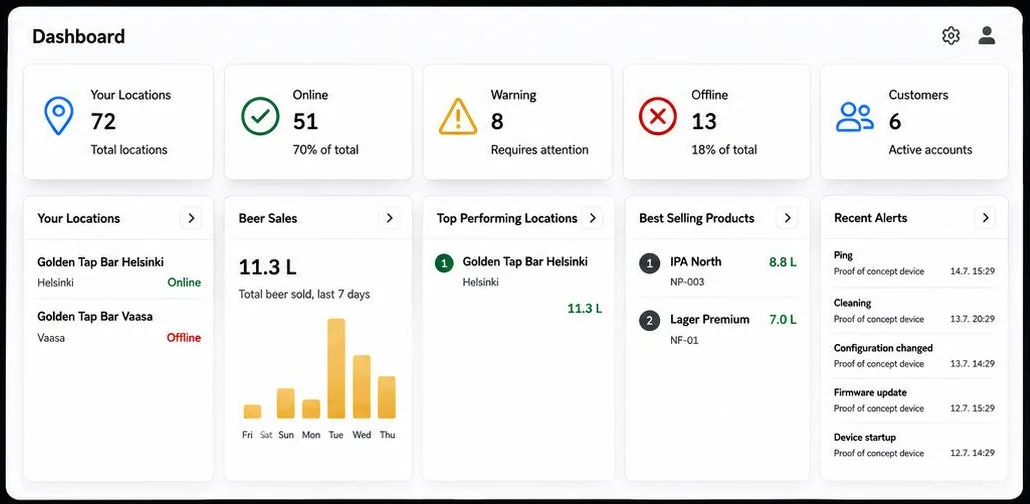
One portal for the whole group.
- 01
Beer sales by venue
This week against last week, in litres and euros, live.
- 02
Locations ranked
Top and under-performing locations ranked automatically.
- 03
Shrinkage league table
The poured-versus-sold gap per venue, so you know where the beer goes.
- 04
Group-wide alerts and status
Offline bars, warm lines and missed cleaning, across every venue.
- 05
Best-selling products
What sells best across the group, for purchasing leverage.
- 06
One report for the board
A monthly Excel or PDF report per venue.
The beer never sleeps. Neither do we.
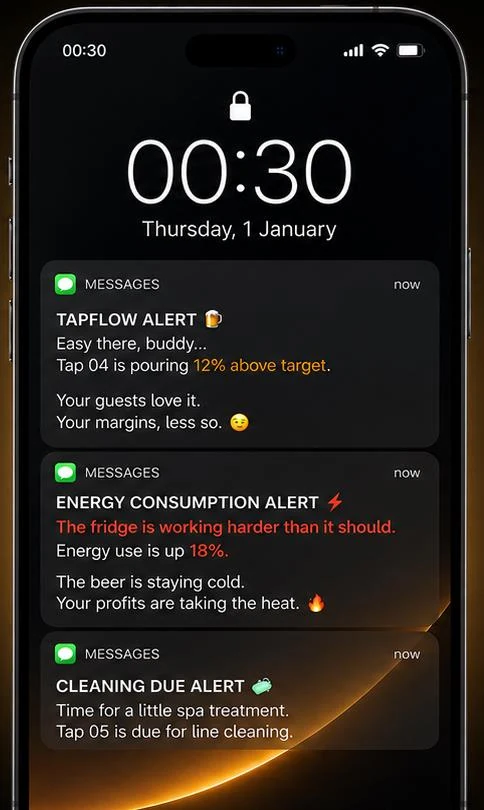
Real-time alerts for the things that matter, straight to your phone.
Overpouring
Easy there, buddy…
Tap 04 is getting a little too generous: pours are above the target size.
Storage temperature
Your beer is feeling a bit tropical.
The temperature in storage is above the recommended range.
Cleaning due
Time for a little spa treatment.
Tap 05 is due for line cleaning.
Sales spike
Well, look at you.
Sales on tap 01 are running well above normal.
Beer quality
The beer does not look happy.
Excessive foam or reduced clarity on tap 04. Before your guests notice, you might want to take a look.
Energy consumption
The fridge is working harder than it should.
The beer is staying cold, but energy use is up. Your profits are taking the heat.
Roles that fit.
Access for bar owners, restaurant groups, breweries, distributors and service companies.
Group admin
Sees everything: the full overview of every venue.
Venue manager
Sees their own bar and can focus on what matters there.
Service company
Sees the technical status only, and solves issues faster.
The board
One monthly report per venue, in Excel or PDF.
What we measure.
- 01
Pour volume
Every pour in real time, with start and end time, duration, product and tap.
- 02
Storage temperature
Make sure beer is stored within the ideal range, line by line.
- 03
Line cleaning status
Cleaning schedules and due alerts, so no line is forgotten.
- 04
Sales flow rate
Flow rate and sales spikes, tap by tap.
- 05
Beer quality indicators
Foam level and clarity trends.
- 06
Energy consumption
Energy use and efficiency of coolers and other equipment, in real time.
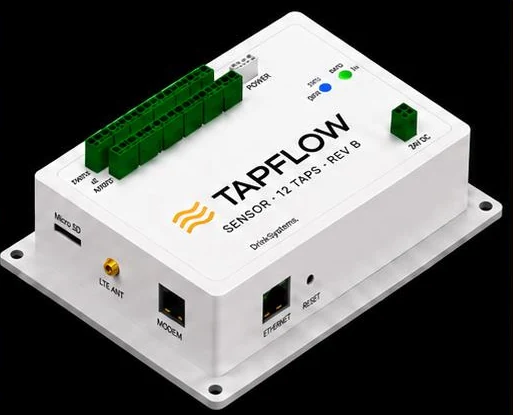
This is the box you will never see.
It hides behind the tap, connects to the internet and does all the heavy lifting. The bar and the beer move; TAPFLOW does not.
Up to 12 taps per unit
Up to 12 flow meters and 2 line temperature sensors per unit.
Always connected
Ethernet, Wi-Fi or LTE. During a network outage data is buffered locally and synchronised automatically when the connection returns.
Works with what you have
RS-485 Modbus, controller and relay integration, and POS integration via the cloud.
Retrofit in existing systems
DIN rail or cabinet mounting, screw terminals and 24 V DC, installed in existing beverage dispensing systems.
Reporting and API access
Waste monitoring, sales analytics, multi-site dashboards, reports and an API for your own systems.
We do not guess. We measure.
Since 1985 DrinkSystems has built flow meters, dispensers, controllers and monitoring systems for breweries, restaurants, bars and cruise ships across the Nordics. We are still doing exactly the same thing, with smaller devices and smarter software. The mission has not changed: less waste, more control, better pours.
See your own numbers.
Tell us about your venues and we will show you the Cloud Portal.